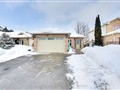
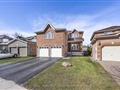
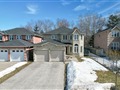
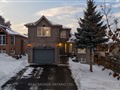
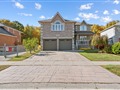
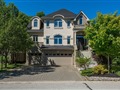
63 Gore Dr
$955,655
Comparative Market Analysis
Jul 4, 2025
NOT AN ACTIVE LISTING
Historical Performance
| Period | $ Change | % Change |
| 1 Day | +$313 | +0.033% |
| 7 Days | +$299 | +0.031% |
| 30 Days | -$1,489 | -0.156% |
| 3 Months | -$2,855 | -0.298% |
| 6 Months | +$15.0k | +1.59% |
| 1 Year | -$44.9k | -4.48% |
| 3 Years | +$171k | +21.9% |
| 5 Years | +$287k | +43.0% |
| 10 Years | +$538k | +129% |
List My Property
Real Estate Statistics
Financing Solutions
AS SEEN ON


Are You a Licensed Real Estate Agent or Broker?