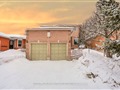
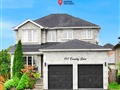
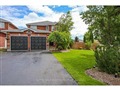
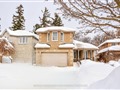
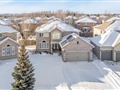
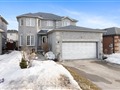
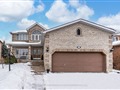
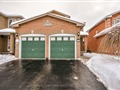
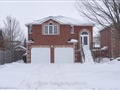
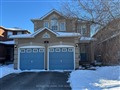
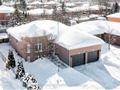
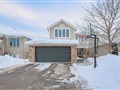
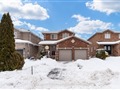
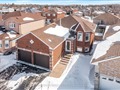
93 Chalmers Dr
$903,845
Comparative Market Analysis
Jun 24, 2025
NOT AN ACTIVE LISTING
Historical Performance
| Period | $ Change | % Change |
| 1 Day | +$301 | +0.033% |
| 7 Days | +$335 | +0.037% |
| 30 Days | -$1,206 | -0.133% |
| 3 Months | -$2,139 | -0.236% |
| 6 Months | +$15.2k | +1.71% |
| 1 Year | -$39.9k | -4.23% |
| 3 Years | +$169k | +23.1% |
| 5 Years | +$295k | +48.4% |
| 10 Years | +$514k | +132% |
List My Property
Real Estate Statistics
Financing Solutions
AS SEEN ON


Are You a Licensed Real Estate Agent or Broker?