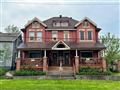
63 Mary St
$619,680
Comparative Market Analysis
Jun 25, 2025
NOT AN ACTIVE LISTING
Historical Performance
| Period | $ Change | % Change |
| 1 Day | +$213 | +0.034% |
| 7 Days | +$328 | +0.053% |
| 30 Days | -$399 | -0.064% |
| 3 Months | -$140 | -0.023% |
| 6 Months | +$13.2k | +2.18% |
| 1 Year | -$20.3k | -3.18% |
| 3 Years | +$136k | +28.1% |
| 5 Years | +$237k | +62.1% |
| 10 Years | +$351k | +131% |
List My Property
Real Estate Statistics
Financing Solutions
Browsing History
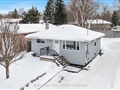
94 Mary St, Barrie
1 second ago
AS SEEN ON


Are You a Licensed Real Estate Agent or Broker?