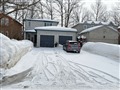
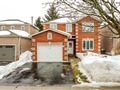
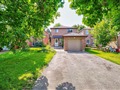
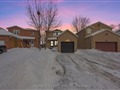
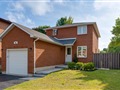
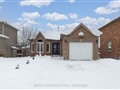
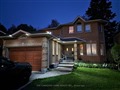
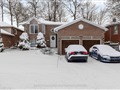
57 Mcveigh Dr
$748,679
Comparative Market Analysis
Jun 27, 2025
NOT AN ACTIVE LISTING
Historical Performance
| Period | $ Change | % Change |
| 1 Day | +$255 | +0.034% |
| 7 Days | +$419 | +0.056% |
| 30 Days | -$344 | -0.046% |
| 3 Months | +$357 | +0.048% |
| 6 Months | +$17.2k | +2.35% |
| 1 Year | -$21.2k | -2.75% |
| 3 Years | +$180k | +31.6% |
| 5 Years | +$294k | +64.8% |
| 10 Years | +$438k | +141% |
List My Property
Real Estate Statistics
Financing Solutions
Browsing History
88 Letitia St, Barrie
5 seconds ago
AS SEEN ON

Are You a Licensed Real Estate Agent or Broker?