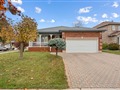
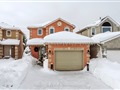
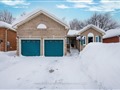
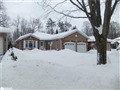
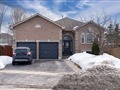
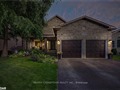
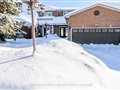
43 Ginger Dr
$882,816
Comparative Market Analysis
Jun 1, 2025
NOT AN ACTIVE LISTING
Historical Performance
| Period | $ Change | % Change |
| 1 Day | +$294 | +0.033% |
| 7 Days | +$561 | +0.064% |
| 30 Days | -$21 | -0.002% |
| 3 Months | +$1,764 | +0.200% |
| 6 Months | +$23.1k | +2.69% |
| 1 Year | -$18.7k | -2.07% |
| 3 Years | +$241k | +37.6% |
| 5 Years | +$399k | +82.5% |
| 10 Years | +$601k | +213% |
List My Property
Real Estate Statistics
Financing Solutions
Browsing History
9 Edge Water Dr, Barrie
2 seconds ago
4 Hill Crt, Barrie
3 seconds ago
11 Gadwall Ave, Barrie
4 seconds ago
812 Lockhart Rd, Barrie
5 seconds ago
24 Succession Cres, Barrie
6 seconds ago
9 Orchard Dr, Barrie
7 seconds ago
6 Snowden Ave, Barrie
8 seconds ago
8 Snowden Ave, Barrie
10 seconds ago
8 Succession Cres, Barrie
11 seconds ago
28 Carr Dr, Barrie
12 seconds ago
AS SEEN ON


Are You a Licensed Real Estate Agent or Broker?