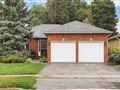
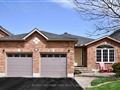
43 Browning Tr
$644,489
Comparative Market Analysis
Jul 5, 2025
NOT AN ACTIVE LISTING
Historical Performance
| Period | $ Change | % Change |
| 1 Day | +$216 | +0.034% |
| 7 Days | +$244 | +0.038% |
| 30 Days | -$850 | -0.132% |
| 3 Months | -$1,522 | -0.236% |
| 6 Months | +$10.8k | +1.71% |
| 1 Year | -$28.5k | -4.24% |
| 3 Years | +$118k | +22.4% |
| 5 Years | +$215k | +49.9% |
| 10 Years | +$386k | +149% |
List My Property
Real Estate Statistics
Financing Solutions
AS SEEN ON


Are You a Licensed Real Estate Agent or Broker?