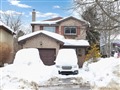
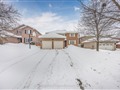
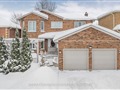
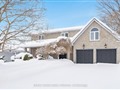
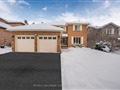
411 Leacock Dr
$1,014,657
Comparative Market Analysis
Jun 19, 2025
NOT AN ACTIVE LISTING
Historical Performance
| Period | $ Change | % Change |
| 1 Day | +$348 | +0.034% |
| 7 Days | +$304 | +0.030% |
| 30 Days | -$1,799 | -0.177% |
| 3 Months | -$4,015 | -0.394% |
| 6 Months | +$13.6k | +1.36% |
| 1 Year | +$270k | +36.2% |
| 3 Years | +$420k | +70.7% |
| 5 Years | +$502k | +98.1% |
| 10 Years | +$695k | +217% |
List My Property
Real Estate Statistics
Financing Solutions
Browsing History
295 Leacock Dr, Barrie
5 seconds ago
AS SEEN ON


Are You a Licensed Real Estate Agent or Broker?