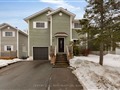
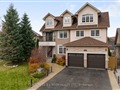
39 Silver Tr
$967,900
Comparative Market Analysis
Jun 6, 2025
NOT AN ACTIVE LISTING
Historical Performance
| Period | $ Change | % Change |
| 1 Day | +$317 | +0.033% |
| 7 Days | +$304 | +0.031% |
| 30 Days | -$1,502 | -0.155% |
| 3 Months | -$2,891 | -0.298% |
| 6 Months | +$15.1k | +1.59% |
| 1 Year | -$45.8k | -4.52% |
| 3 Years | +$171k | +21.4% |
| 5 Years | +$288k | +42.4% |
| 10 Years | +$559k | +137% |
List My Property
Real Estate Statistics
Financing Solutions
Browsing History
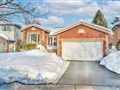
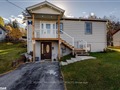
59 Silver Tr, Barrie
5 seconds ago
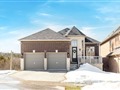
37 Silver Tr, Barrie
10 seconds ago
AS SEEN ON


Are You a Licensed Real Estate Agent or Broker?