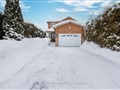
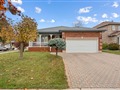
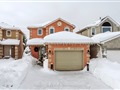
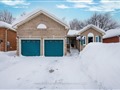
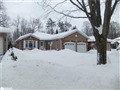
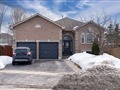
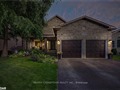
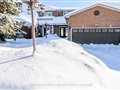
39 Bishop Dr
$834,342
Comparative Market Analysis
Jul 11, 2025
NOT AN ACTIVE LISTING
Historical Performance
| Period | $ Change | % Change |
| 1 Day | +$278 | +0.033% |
| 7 Days | +$336 | +0.040% |
| 30 Days | -$983 | -0.118% |
| 3 Months | -$1,555 | -0.186% |
| 6 Months | +$14.9k | +1.82% |
| 1 Year | -$34.9k | -4.02% |
| 3 Years | +$166k | +24.8% |
| 5 Years | +$283k | +51.4% |
| 10 Years | +$519k | +165% |
List My Property
Real Estate Statistics
Financing Solutions
Browsing History
Detached Homes in Grove East, Barrie
3 seconds ago
14 Bishop Dr, Barrie
3 seconds ago
AS SEEN ON


Are You a Licensed Real Estate Agent or Broker?