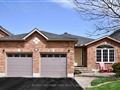
35 Player Dr
$1,040,878
Comparative Market Analysis
Jul 1, 2025
NOT AN ACTIVE LISTING
Historical Performance
| Period | $ Change | % Change |
| 1 Day | +$349 | +0.034% |
| 7 Days | +$288 | +0.028% |
| 30 Days | -$1,893 | -0.181% |
| 3 Months | -$4,151 | -0.397% |
| 6 Months | +$14.0k | +1.36% |
| 1 Year | +$85.0k | +8.90% |
| 3 Years | +$242k | +30.3% |
| 5 Years | +$367k | +54.4% |
| 10 Years | +$610k | +141% |
List My Property
Real Estate Statistics
Financing Solutions
Browsing History
21 Chippawa Crt, Barrie
5 seconds ago
AS SEEN ON


Are You a Licensed Real Estate Agent or Broker?