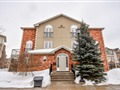
35 Loggers Run 18
$524,811
Comparative Market Analysis
May 14, 2025
NOT AN ACTIVE LISTING
Historical Performance
| Period | $ Change | % Change |
| 1 Day | +$208 | +0.040% |
| 7 Days | +$347 | +0.066% |
| 30 Days | -$428 | -0.082% |
| 3 Months | -$1,293 | -0.246% |
| 6 Months | +$7,176 | +1.39% |
| 1 Year | -$25.9k | -4.71% |
| 3 Years | +$84.8k | +19.3% |
| 5 Years | +$140k | +36.4% |
| 10 Years | +$291k | +124% |
List My Property
Real Estate Statistics
Financing Solutions
AS SEEN ON


Are You a Licensed Real Estate Agent or Broker?