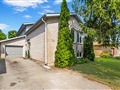
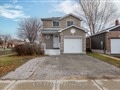
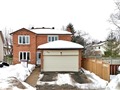
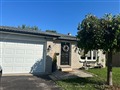
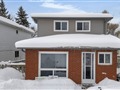
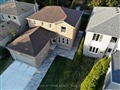
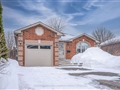
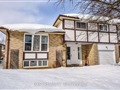
241 Hickling Tr
$714,562
Comparative Market Analysis
Jun 27, 2025
NOT AN ACTIVE LISTING
Historical Performance
| Period | $ Change | % Change |
| 1 Day | +$245 | +0.034% |
| 7 Days | +$287 | +0.040% |
| 30 Days | -$902 | -0.126% |
| 3 Months | -$1,594 | -0.223% |
| 6 Months | +$12.3k | +1.74% |
| 1 Year | -$30.4k | -4.08% |
| 3 Years | +$137k | +23.7% |
| 5 Years | +$228k | +46.8% |
| 10 Years | +$409k | +134% |
List My Property
Real Estate Statistics
Financing Solutions
Browsing History
44 Golden Eagle Way, Barrie
6 seconds ago
AS SEEN ON

Are You a Licensed Real Estate Agent or Broker?