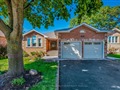
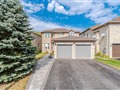
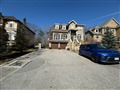
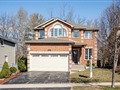
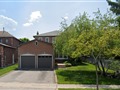
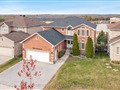
23 Nicholson Dr
$884,701
Comparative Market Analysis
May 2, 2024
NOT AN ACTIVE LISTING
Historical Performance
| Period | $ Change | % Change |
| 1 Day | +$290 | +0.033% |
| 7 Days | +$383 | +0.043% |
| 30 Days | -$855 | -0.097% |
| 3 Months | -$935 | -0.106% |
| 6 Months | +$17.4k | +2.01% |
| 1 Year | -$33.2k | -3.62% |
| 3 Years | +$186k | +26.7% |
| 5 Years | +$315k | +55.4% |
| 10 Years | +$551k | +166% |
List My Property
Real Estate Statistics
Financing Solutions
AS SEEN ON


Are You a Licensed Real Estate Agent or Broker?