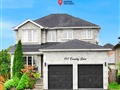
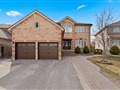
22 Max Ave
$810,189
Comparative Market Analysis
Jun 6, 2025
NOT AN ACTIVE LISTING
Historical Performance
| Period | $ Change | % Change |
| 1 Day | +$270 | +0.033% |
| 7 Days | +$256 | +0.032% |
| 30 Days | -$1,302 | -0.160% |
| 3 Months | -$2,649 | -0.326% |
| 6 Months | +$12.1k | +1.52% |
| 1 Year | -$39.5k | -4.65% |
| 3 Years | +$139k | +20.6% |
| 5 Years | +$242k | +42.5% |
| 10 Years | +$460k | +131% |
List My Property
Real Estate Statistics
Financing Solutions
Browsing History
207 Bertha Ave, Barrie
1 second ago
206 Walnut Cres, Barrie
2 seconds ago
207 Deborah Way, Barrie
2 seconds ago
1 Windsor Cres, Barrie
3 seconds ago
17 Windsor Cres, Barrie
3 seconds ago
18 Max Ave, Barrie
3 seconds ago
31 Max Ave, Barrie
4 seconds ago
AS SEEN ON

Are You a Licensed Real Estate Agent or Broker?