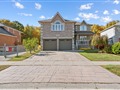
113 Bishop Dr
$747,236
Comparative Market Analysis
Jul 11, 2025
NOT AN ACTIVE LISTING
Historical Performance
| Period | $ Change | % Change |
| 1 Day | +$245 | +0.033% |
| 7 Days | +$207 | +0.028% |
| 30 Days | -$1,298 | -0.173% |
| 3 Months | -$2,682 | -0.358% |
| 6 Months | +$10.7k | +1.46% |
| 1 Year | -$37.6k | -4.79% |
| 3 Years | +$124k | +20.0% |
| 5 Years | +$209k | +38.9% |
| 10 Years | +$414k | +124% |
List My Property
Real Estate Statistics
Financing Solutions
Browsing History
55 Florence Park St, Barrie
2 seconds ago
184 Ferndale Dr, Barrie
3 seconds ago
43 Ferndale Dr, Barrie
4 seconds ago
196 Bishop Dr, Barrie
4 seconds ago
AS SEEN ON

Are You a Licensed Real Estate Agent or Broker?