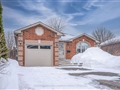
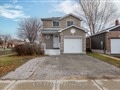
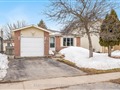
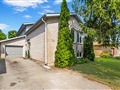
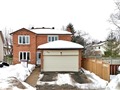
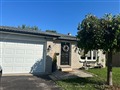
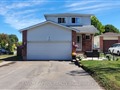
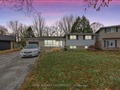
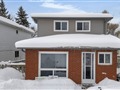
11 Fletcher Dr
$656,425
Comparative Market Analysis
Jul 6, 2025
NOT AN ACTIVE LISTING
Historical Performance
| Period | $ Change | % Change |
| 1 Day | +$225 | +0.034% |
| 7 Days | +$592 | +0.090% |
| 30 Days | +$1,057 | +0.161% |
| 3 Months | +$7,076 | +1.09% |
| 6 Months | +$33.1k | +5.30% |
| 1 Year | +$3,871 | +0.593% |
| 3 Years | +$127k | +24.0% |
| 5 Years | +$193k | +41.7% |
| 10 Years | +$400k | +156% |
List My Property
Real Estate Statistics
Financing Solutions
AS SEEN ON

Are You a Licensed Real Estate Agent or Broker?