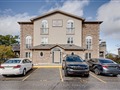
11 Cheltenham Rd 2
$529,425
Comparative Market Analysis
Jun 6, 2025
NOT AN ACTIVE LISTING
Historical Performance
| Period | $ Change | % Change |
| 1 Day | +$279 | +0.053% |
| 7 Days | +$267 | +0.051% |
| 30 Days | -$327 | -0.062% |
| 3 Months | -$1,728 | -0.325% |
| 6 Months | +$6,075 | +1.16% |
| 1 Year | -$27.8k | -4.98% |
| 3 Years | +$104k | +24.5% |
| 5 Years | +$220k | +71.2% |
| 10 Years | +$338k | +177% |
List My Property
Real Estate Statistics
Financing Solutions
Browsing History
14 Batteaux St, Barrie
2 seconds ago
9 Elizabeth St, Barrie
3 seconds ago
63 Hawthorne Cres, Barrie
4 seconds ago
222 Hickling Tr, Barrie
13 seconds ago
205 Hickling Tr, Barrie
14 seconds ago
75 Hawthorne Cres, Barrie
15 seconds ago
59 Elizabeth St, Barrie
16 seconds ago
30 Bell St, Barrie
17 seconds ago
44 Crompton Dr, Barrie
18 seconds ago
29 Hawthorne Cres, Barrie
19 seconds ago
AS SEEN ON

Are You a Licensed Real Estate Agent or Broker?